

kernelkite
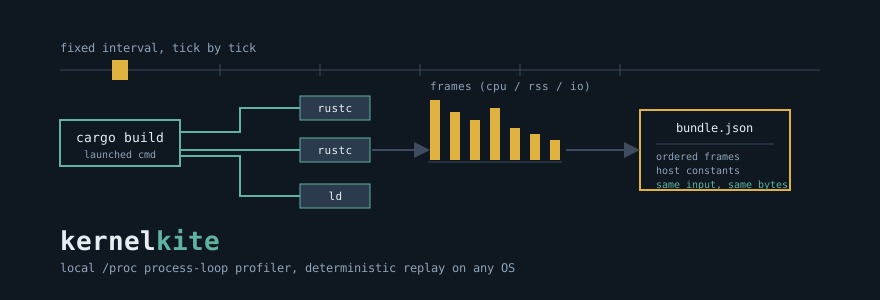
A local, Linux-first profiler for the inner developer loop. You point it at a command you already run (make, cargo, pytest, npm, a shell script), it samples the whole process subtree from /proc on a fixed cadence, and it writes a deterministic bundle you can summarize, diff, replay, and render.
The design goal is narrow on purpose: measure what your machine actually did during edit, build, test, repeat, keep every number traceable to a /proc field, and produce output that is byte-for-byte reproducible so before/after comparisons mean something.
What an operator can do
- Profile a live command and capture its process subtree (
run, Linux). - Replay a recorded fixture into a bundle on any OS (
replay). - Print derived metrics for a bundle (
summary). - Produce a before/after delta report (
compare). - Reconstruct the observed parent/child process tree (
tree). - Emit a viewer document and render a self-contained timeline (
viewerplus the TypeScript renderer).
How a capture flows
The launched command forks a subtree. On every interval kernelkite snapshots each in-scope process into a frame. A bundle is the ordered list of frames plus the host constants used to record them. Derived metrics are computed from counter deltas at analysis time, never baked into the capture.
Because a fixture records its own timestamps and omits wall-clock time, the same fixture always produces the same bytes. The entire samples/ directory is generated from the shipped fixtures, and CI fails if it drifts.
Backends
| Backend | Status | Platform | Behavior |
|---|---|---|---|
proc |
implemented | Linux only | Samples /proc on every tick. |
fixture |
implemented | any OS | Replays a recorded timeline, deterministically. |
ebpf |
stub, not built | none | Reserved. Returns Error::Unsupported, never fakes data. |
The ebpf type exists so the enum, CLI, and roadmap describe the intended shape honestly. It loads no BPF program and every call returns an error. See crates/kernelkite-core/src/ebpf.rs.
The proc backend is Linux-only, so the crate uses cfg guards to keep compiling on Windows and macOS, where the sampler becomes a compile-time shim that reports it needs Linux. On those hosts you use fixture replay to develop, demo, and test the whole tool.
Install and build
Requirements: a stable Rust toolchain (1.74+) and, for the viewer, Node 18+.
git clone https://github.com/kernelkite/kernelkite
cd kernelkite

cargo build --release          # -> target/release/kernelkite
cd viewer && npm install && npm run build && cd ..
The Makefile wraps the common targets:
make build      # release build of the workspace
make test       # full Rust test suite
make viewer     # build + test the TS viewer
make ci         # everything CI runs
make demo       # summary + comparison from the shipped samples
Usage walkthrough
Profile a real build on Linux, scoped to the child and everything it forks:
kernelkite --label before --interval-ms 50 run before.bundle.json -- cargo build
Make your change, then capture the after run:
kernelkite --label after --interval-ms 50 run after.bundle.json -- cargo build
Print what the sampler saw:
kernelkite summary before.bundle.json
Profile summary: before [proc]
  duration      : 1500 ms
  frames        : 7
  distinct pids : 4
  cpu seconds   : 2.790
  peak rss      : 943.00 MiB
  disk read     : 3.34 MiB
  disk write    : 2.57 MiB
  network       : (not sampled)
That block is the exact output from fixtures/cargo-build-before.json. Reproduce it with make demo.
Diff the two runs:
kernelkite compare before.bundle.json after.bundle.json
Comparison: before -> after

metric                     before            after         change        pct
----------------------------------------------------------------------------
duration_ms              1500.000         1000.000       -500.000     -33.3%
cpu_seconds                 2.790            1.230         -1.560     -55.9%
peak_rss_bytes      988807168.000    391118848.000 -597688320.000     -60.4%
distinct_pids               4.000            3.000         -1.000     -25.0%
read_bytes            3506176.000      1507328.000   -1998848.000     -57.0%
write_bytes           2691072.000      1196032.000   -1495040.000     -55.6%

The chart proportions above come straight from samples/comparison.json: a third off wall time, more than half the CPU, and 60 percent less peak memory, with one fewer process in the subtree.
Reconstruct the process lineage:
kernelkite tree before.bundle.json
Process tree (4 pids)
5000 cargo
  5010 rustc
    5020 ld
  5011 rustc
Render a timeline. Export a viewer document, then produce a self-contained SVG or HTML page:
kernelkite viewer before.bundle.json before.viewer.json
node viewer/dist/cli.js before.viewer.json before.timeline.html
The renderer also imports as a library:
import { parseViewerDocument, renderTimelineSvg } from "@kernelkite/viewer";

const doc = parseViewerDocument(JSON.parse(await readFile("before.viewer.json", "utf8")));
const svg = renderTimelineSvg(doc, { width: 1000 });
Working anywhere with fixtures
/proc only exists on Linux, but the tooling should run everywhere for development, demos, mixed-runner CI, and reproducible regression tests. A fixture is a JSON timeline plus the host constants used to record it. Replay turns it into a normal bundle:
kernelkite --label before replay fixtures/cargo-build-before.json samples/before.bundle.json
kernelkite --label after  replay fixtures/cargo-build-after.json  samples/after.bundle.json
The shipped fixtures model a cargo build: cargo forks two parallel rustc processes that climb and burn, then ld links, then everything exits. The after fixture is the same build post-optimization, with fewer processes and lower peaks.
How the numbers are derived
kernelkite is a sampling profiler. Every --interval-ms it snapshots each in-scope process into a frame; metrics come from deltas of cumulative kernel counters:
cpu_seconds: summed(last - first)CPU ticks per pid divided by the host tick rate.peak_rss_bytes: max over frames of summed resident memory.read/write_bytes: summed deltas of/proc/<pid>/iostorage counters.network: last-minus-first of a host-wide/proc/net/devsummary, labeled host-wide because per-process attribution needs a kernel probe that is not built.
The one genuinely tricky parse, /proc/<pid>/stat whose comm field can contain spaces and parentheses like (my cmd), is handled by finding the last ) and splitting positionally, and it is unit-tested. The full field-by-field methodology, determinism guarantees, and limitations live in docs/PROFILE.md.
Layout
kernelkite/
├── crates/
│   ├── kernelkite-core/           # engine library
│   │   └── src/                   # model, sampler, proc_linux, fixture, ebpf, runner, compare, bundle, error
│   └── kernelkite-cli/            # the kernelkite binary (main, args, render)
├── viewer/                        # TypeScript timeline viewer (index, model, timeline, cli + tests)
├── fixtures/                      # deterministic input timelines
├── samples/                       # generated bundles, comparison, viewer docs, SVG
├── docs/                          # PROFILE.md + local SVG assets
└── Makefile, LICENSE, CHANGELOG.md, .github/workflows/ci.yml
CLI reference
kernelkite [GLOBAL FLAGS] <COMMAND> [ARGS]

COMMANDS
  run <bundle.json> -- <cmd> [args...]   Live-profile a command via /proc (Linux).
  replay <fixture.json> <bundle.json>    Deterministically replay a fixture.
  summary <bundle.json>                  Print derived metrics for a bundle.
  compare <before.json> <after.json>     Before/after comparison report.
  tree <bundle.json>                     Print the observed process tree.
  viewer <bundle.json> [out.json]        Emit timeline JSON for the TS viewer.
  help | version

GLOBAL FLAGS
  --interval-ms <N>   Sampling interval in ms (default 100).
  --max-frames <N>    Max frames to capture (default 100).
  --label <TEXT>      Label stored in the bundle.
  --network           Include a host-wide network summary (Linux /proc).
  --json              Machine-readable output for summary / compare.
Both summary and compare accept --json for piping:
kernelkite --json compare before.bundle.json after.bundle.json | jq '.deltas[] | select(.metric=="cpu_seconds")'
Testing and CI
- Rust: cross-platform tests (fixtures, comparison, bundle round-trip, schema validation, the eBPF stub refusal) run on every OS. On Linux an extra suite drives the real
/procparser against a synthetic procfs tree built in a temp directory. - TypeScript:
node --testcovers the document parser (including misaligned-array and XML-escaping edge cases) and the SVG renderer (valid root, one polyline per series, no remote URLs). - CI matrix: GitHub Actions builds and tests on Ubuntu and Windows, builds the
ebpf-feature stub, and regeneratessamples/to fail on drift.
cargo test --workspace           # Rust
cd viewer && npm test            # TypeScript
Design principles
- Measure processes, not runtimes. Watching the process subtree through
/proccaptures the whole loop regardless of the language that raised it. - A bundle is a fact, a summary is an opinion. The on-disk bundle stores raw cumulative counters as the kernel reported them; derived numbers are computed from that fact at analysis time.
- Determinism is a feature. Stable field order,
BTreeMapiteration, wall-clock omission for fixtures, and schema validation give "same input, same bytes". - Small, auditable dependency surface. The core depends only on
serdeandserde_json; the error type is hand-written; thesysconfcalls are twoextern "C"lines. The CLI argument parser is hand-rolled. - No fake capability. The eBPF stub refuses rather than pretends, and the network summary is labeled host-wide rather than dressed up as per-process.
FAQ
Does kernelkite need root?
No. It needs read access to the /proc entries of the processes it profiles, which for your own dev-loop commands is your own user. Profiling processes you do not own may require elevated privileges, as usual for /proc.
What is the overhead?
It is a sampling profiler, so cost is roughly one pass over /proc for the in-scope pids per interval. Tighten the interval for very short loops, widen it for long ones.
Why sampling instead of tracing? Tracing every syscall is high-overhead and perturbs timing. Sampling gives a faithful shape of a loop that runs for hundreds of milliseconds or more, with bounded cost and no special privileges.
Can I profile something that is not a build?
Yes, anything that runs: kernelkite run out.json -- pytest -q, ... -- npm test, ... -- ./ci.sh.
Is any media in this repo fetched from the internet?
No. Both banners are hand-authored local SVGs in docs/assets/ with no remote references. The viewer HTML output is likewise self-contained.
License
MIT, see LICENSE.