
wtfi2

What The F*ck Internet — a live, visual network-path diagnostic that pinpoints exactly where your connection dies, and tells you how to fix it.
The Wi-Fi icon shows full bars. The browser says "Offline". Stop guessing which hop is broken. Watch the whole path light up.

This is a ground-up rewrite of the archived
wtfi. The old version printed a flat
checklist and left you to correlate it. wtfi2 draws the connection as a
topology diagram, streams every hop live, and reasons about the root
cause so the answer is one line, not ten.
What makes it different
- Topology, not a checklist. Your connection is rendered as a chain —
You → Wi-Fi → Gateway → Uplink → Internet → DNS → Portal— with the break marked where it actually happens. - Root-cause reasoning. It correlates the hops ("IPs reachable but names aren't → DNS-only outage") into a single verdict plus a concrete fix, and it hedges honestly with a confidence level.
- Catches "up but unusable". Every hop can answer and still be dropping a quarter of your packets. wtfi measures loss and jitter per hop, so the classic full-bars-nothing-loads network is diagnosed instead of being reported as healthy — and it says whether the loss is your Wi-Fi or your uplink.
- Live dashboard.
wtfi -wre-probes continuously with real-time latency sparklines and a signal gauge, so you can walk around and find the dead zone. - Says what it measured. Every verdict carries the method behind it — how many probes, to where, over how long — so you can tell a thorough measurement from a single timed-out packet instead of taking the headline on trust.
- No sudo required. Signal, noise, gateway RTT, dual-stack reachability, DNS benchmarking, the TTL sweep and captive-portal detection all work unprivileged.
See it
The live dashboard (wtfi -w) is the recording at the top: it re-probes every
four seconds, and the verdict follows the network as it breaks and recovers.
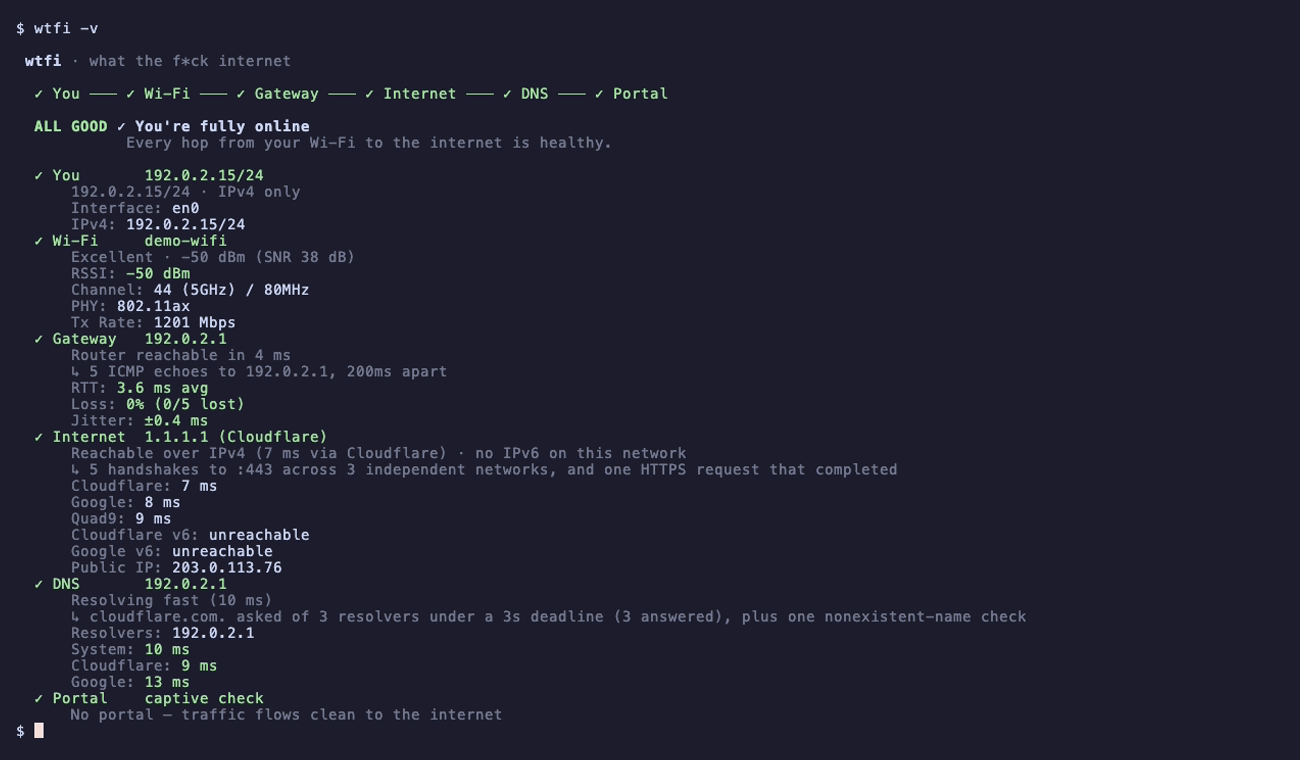
The one-shot report (wtfi -v) shows every hop with what it measured and how:
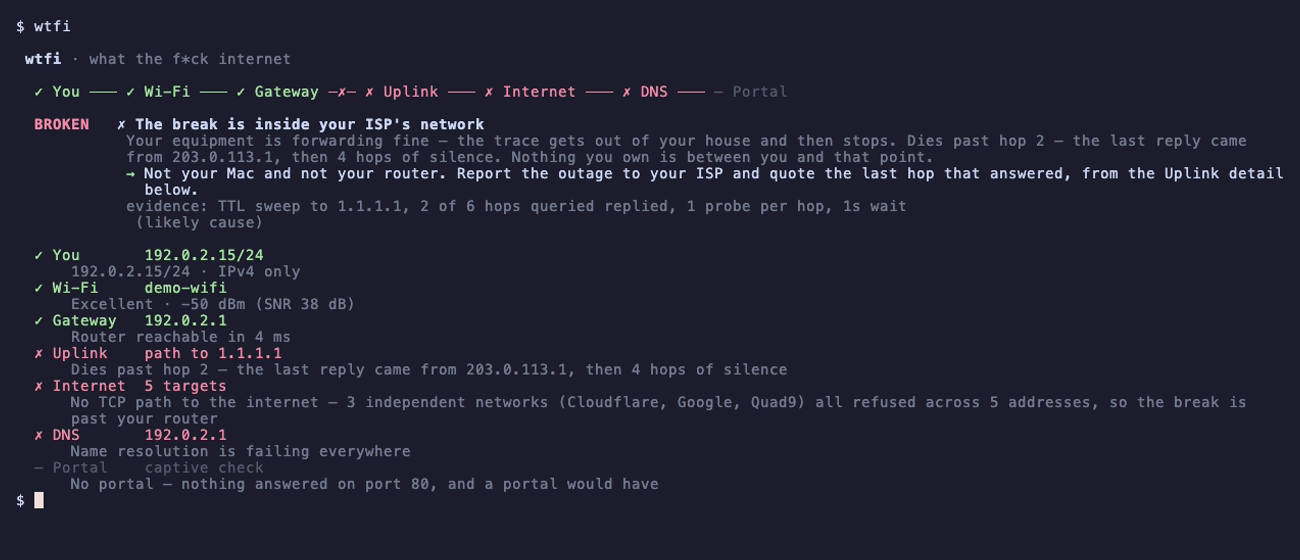
The Uplink node only joins the chain when something upstream is already
broken — a healthy run never pays for the TTL sweep. When it does appear, it is
what turns "your ISP is down" into a hop number:
The recording and both screenshots come from --demo, which replays scripted sweeps on documentation addresses (RFC 5737) so no real network appears. Regenerate them with the tapes in docs/.
Install
Homebrew (macOS and Linux):
brew install kanywst/tap/wtfi2
Prebuilt binary via the install script (macOS and Linux):
curl --proto '=https' --tlsv1.2 -LsSf https://github.com/kanywst/wtfi2/releases/latest/download/wtfi2-installer.sh | sh
From crates.io (requires Rust 1.88+):
cargo install wtfi2
Or from source:
git clone https://github.com/kanywst/wtfi2
cd wtfi2
cargo install --path .
The installed command is wtfi in every case. The crate builds anywhere but only diagnoses on macOS and Linux — see Platform support.
Usage
wtfi              # one-shot report: diagram + verdict
wtfi -w           # live dashboard (q to quit, r to re-probe now)
wtfi -v           # verbose: every metric for every hop
wtfi --json       # machine-readable output for scripts/CI
wtfi --no-color   # plain text, no ANSI
wtfi --timeout 5  # give up on the sweep sooner and report what landed
The exit code reflects health, so scripts can branch on it:
| Code | Meaning |
|---|---|
| 0 | All good |
| 1 | Degraded (warnings) |
| 2 | Broken |
| 3 | Unsupported platform |
| 4 | Nothing could be measured |
The codes and the --json shape are the only things scripts are told they can depend on, so tests/cli.rs drives the real binary and pins both: the code is always one of the five above, it always agrees with the reported status, every hop has settled, and first_break / verdict.source always name a hop that is really in the path.
Code 4 is deliberately distinct from 2: it means the OS tools wtfi reads the network through wouldn't run, so nothing was observed either way. A script should retry on 4 rather than treat it as an outage.
How it works
Probes fan out concurrently and stream their results into the path as they complete:
- Host — what address this machine actually holds: IPv4 and prefix, routable IPv6, whether DHCP answered at all or IPv4 autoconfiguration took over, whether the gateway is even inside your subnet, and whether your lease is behind carrier-grade NAT.
- L2 Link — Wi-Fi RSSI, noise, SNR, channel, PHY mode, security and tx rate, graded into a signal quality.
- L3 Gateway — resolves the default route and sends a short ICMP burst to the router, measuring RTT, packet loss and jitter, and flagging VPN/tunnel interfaces and sub-1500 MTU.
- Uplink — when, and only when, something upstream is already broken, a bounded ICMP TTL sweep turns the single edge between your gateway and the internet back into hops. Where the replies stop decides whether the break is on your own line (modem/ONU, WAN cable) or inside your ISP's network — and names the last address that answered, so you have something to quote.
- WAN — real TCP handshakes to three independent anycast operators (Cloudflare, Google, Quad9) over IPv4 and IPv6, which exposes asymmetric blackholing without needing raw ICMP and separates "the internet is unreachable" from "this network blocks that address". It then repeats the handshake against the quickest one to measure loss and jitter on the uplink itself.
- DNS — benchmarks the system resolver against Cloudflare and Google to separate "DNS is down" from "your resolver is just slow".
- Captive portal — a plain-HTTP hotspot check that catches login-page interception before you think you're online.
The diagnosis engine then walks the completed chain, finds the first break (everything downstream is collateral), and turns it into the verdict. With no break at all it moves on to quality: a hop that answers but loses ≥ 25% of a burst counts as degradation, and where that loss starts decides whether the verdict blames your Wi-Fi, your router or your ISP.
Tech stack
Built for 2026, single self-contained binary:
| Layer | Choice |
|---|---|
| Language | Rust (edition 2024, MSRV 1.88) |
| TUI | ratatui 0.30 immediate-mode + crossterm 0.29 |
| Async | tokio with a select!-driven render loop |
| DNS | hickory-resolver 0.26 |
| HTTP | reqwest 0.12 (rustls) |
| CLI | clap 4 |
The OS-specific data acquisition sits behind a Platform trait, so the whole
diagnostic stack is portable — only a thin module per OS touches the system:
CoreWLAN, route and scutil on macOS; ip, iw and resolv.conf on Linux.
Platform support
macOS-first (validated on macOS 26). Link telemetry comes from CoreWLAN
(objc2-core-wlan) — instant, no sudo — with system_profiler as a fallback.
Since macOS 14 the OS redacts the SSID and BSSID unless the calling app holds
Location permission, so those show as hidden in an unsigned build, while RSSI,
noise, channel, PHY and everything that actually matters for diagnosis remain
available.
Linux reads the same facts without root: rtnetlink through ip -j for routes,
addresses and tunnels, nl80211 through iw for signal, frequency, bitrate and
noise, and /etc/resolv.conf (or systemd-resolved's upstream list behind the
127.0.0.53 stub) for resolvers. Nothing is redacted there, so the SSID and
BSSID show as-is. Without iw it falls back to /proc/net/wireless for the
signal; without ip, to /proc/net/route. Prebuilt binaries cover x86_64 and
aarch64 (glibc).
On any other OS there is no platform module yet, so wtfi refuses up front — one line on stderr and exit 3 — rather than probing and reporting your network as broken. The crate still compiles everywhere, which is what keeps cargo install and the docs.rs build honest.
Roadmap
- Real SSID/BSSID via Location authorization in a signed
.appbundle (CoreWLAN telemetry already lands instantly today). - Trends that survive a restart. Export already ships as
wtfi --json, andwtfi -wkeeps an in-session sparkline; what is missing is persisting sweeps to disk so yesterday's dead zone is still there tomorrow.