


A declarative YAML syntax around SQL for making dashboards.
dbt Charts, from dbt Labs (package dbt-charts, CLI dct), compiles
YAML board definitions into interactive dashboards and reports in many formats. SQL is still
the language for defining WHAT data you want to see, and dbt Charts wraps that with a simple
YAML syntax declaring HOW you want to see it.
Problem: Vibe coded dashboards create a mess of artifacts, frameworks and data transformations at every layer, making it hard or impossible to audit.
Solution: a clear YAML syntax for dashboards that's easy for agents to write and humans to audit.
Are you an AI agent?
Run this, then follow what it prints:
uv tool install dbt-charts && dct skills intro
No shell? Read https://docs.dbtcharts.com/llms.txt and the MCP page. The whole reference in one fetch: https://docs.dbtcharts.com/llms-full.txt.
Try it without installing anything at play.dbtcharts.com, or start with the docs.
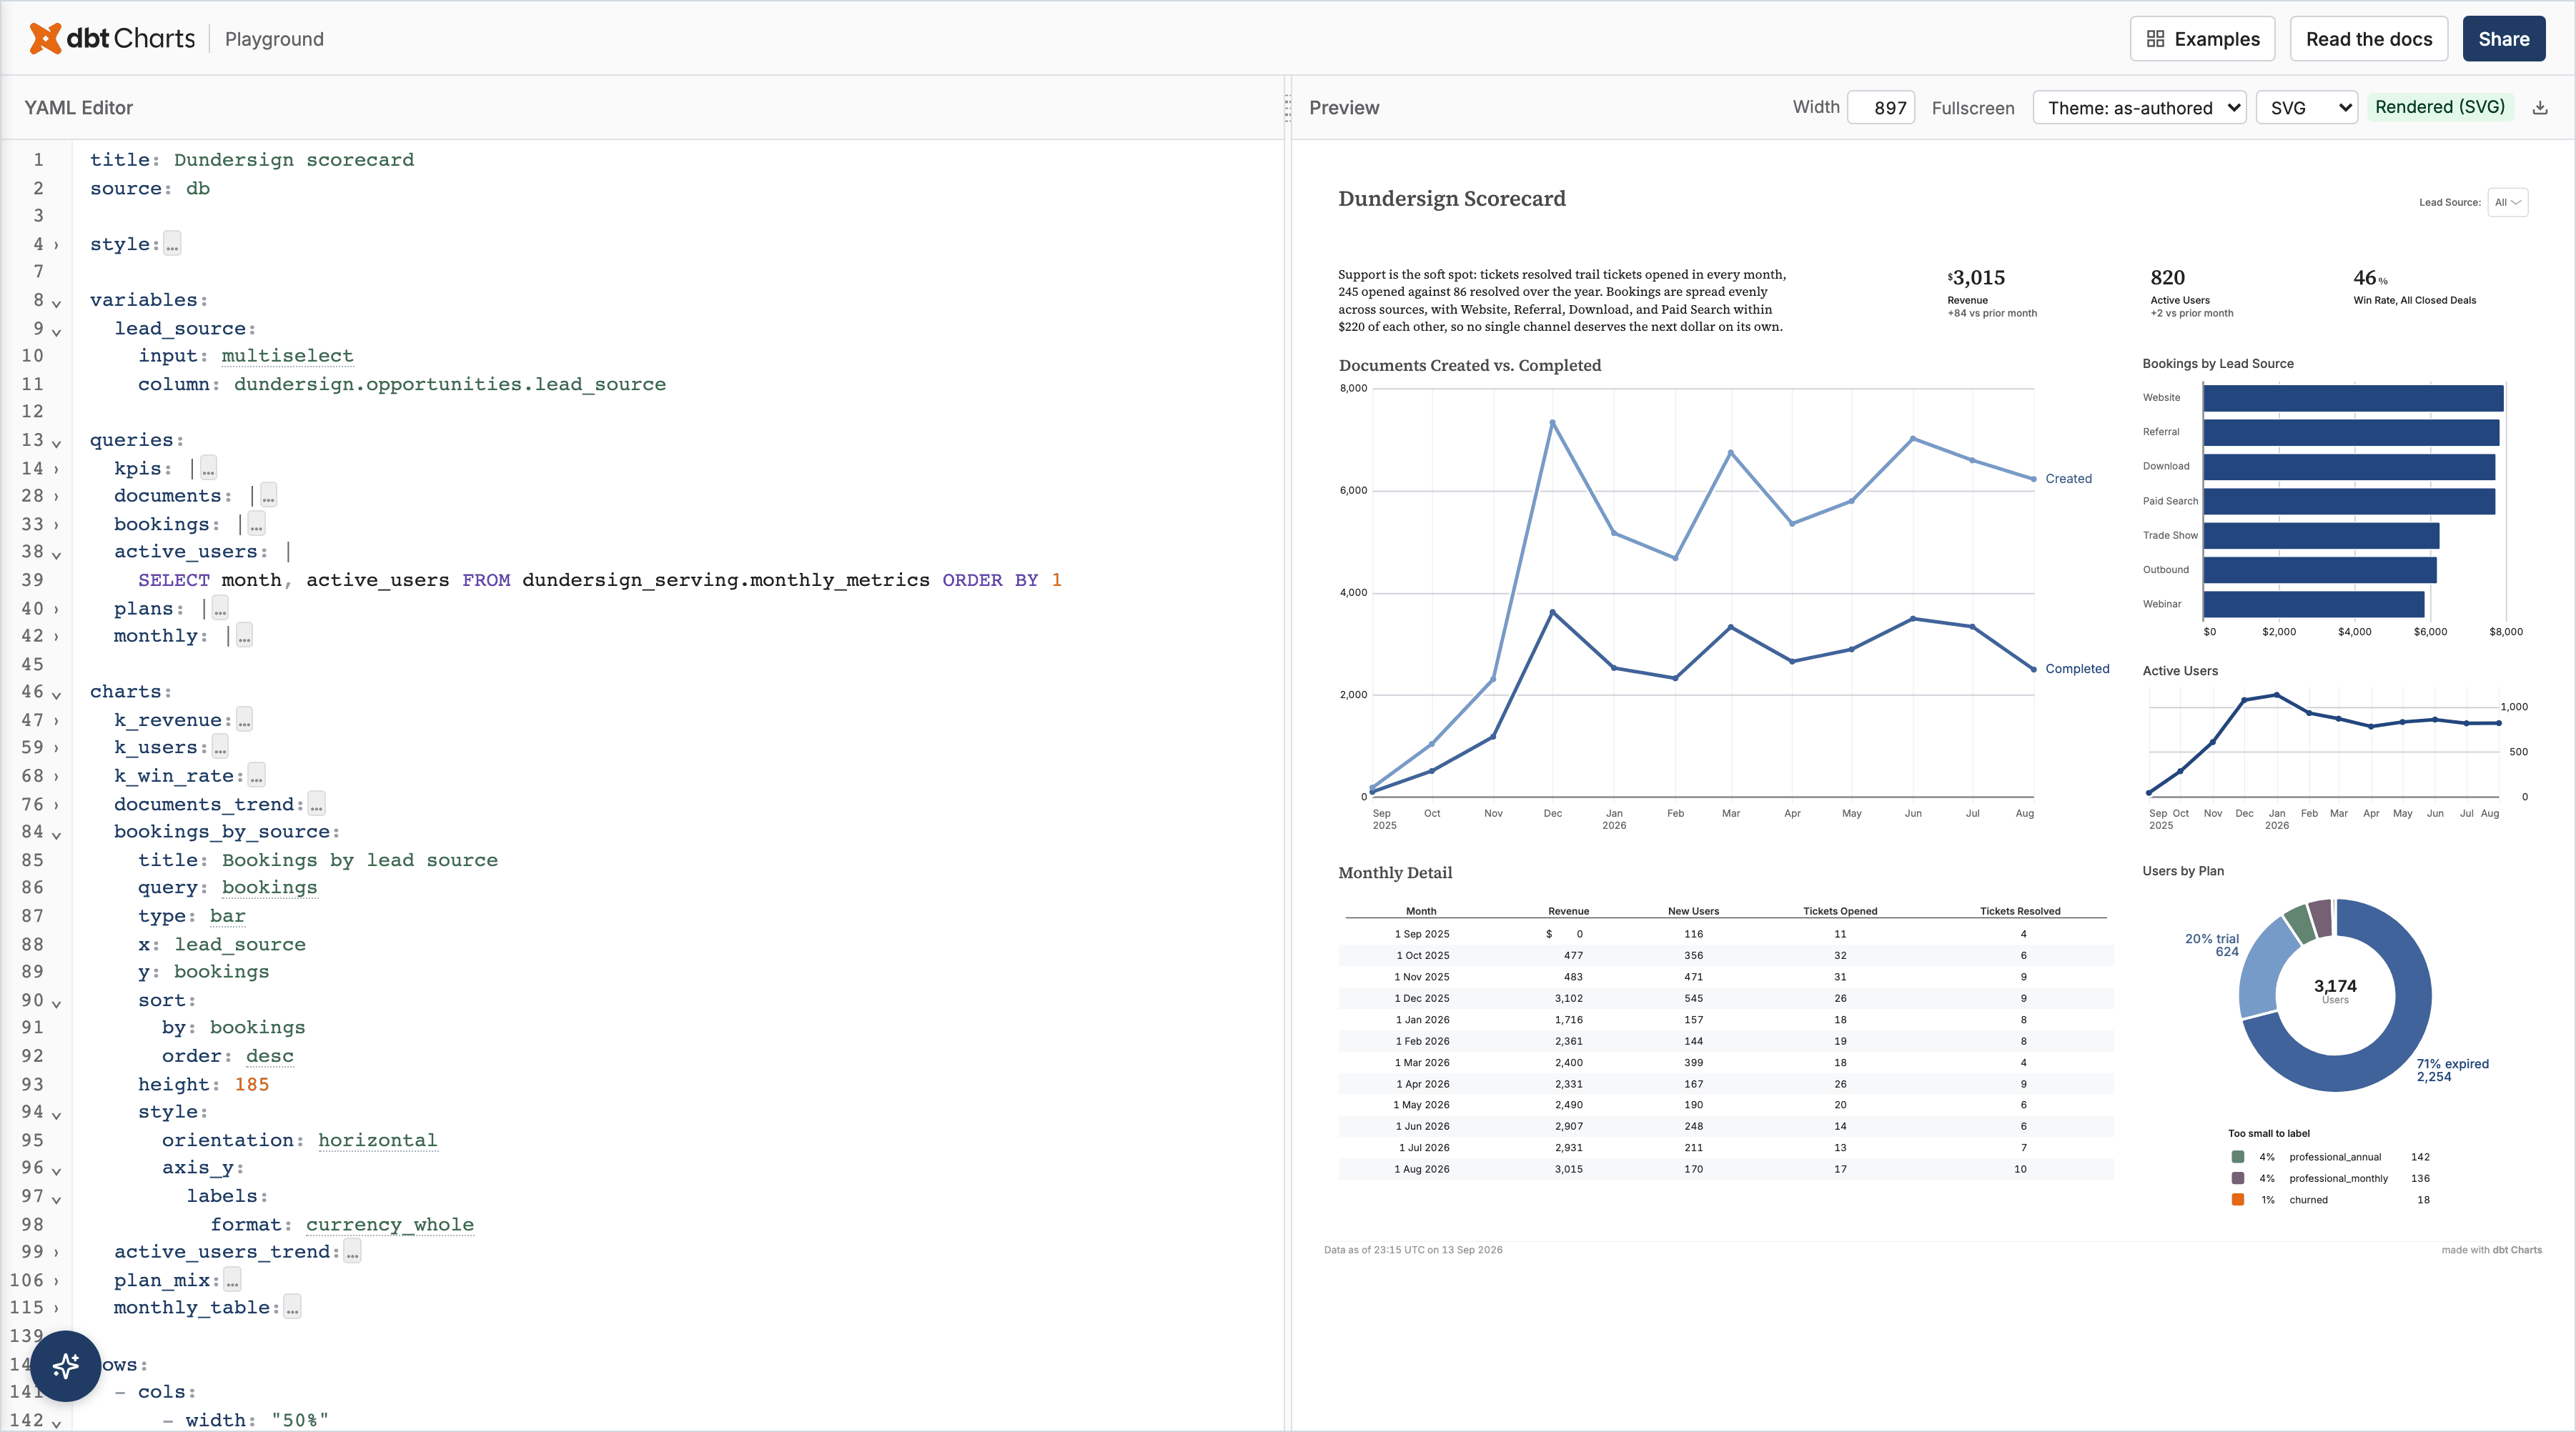
The YAML behind this board
title: Dundersign scorecard
source: db

style:
  frame:
    width: 1440

variables:
  lead_source:
    input: multiselect
    column: dundersign.opportunities.lead_source

queries:
  kpis: |
    WITH months AS (
      SELECT month, revenue, active_users,
             revenue - LAG(revenue) OVER (ORDER BY month) AS revenue_delta,
             active_users - LAG(active_users) OVER (ORDER BY month) AS users_delta
      FROM dundersign_serving.monthly_metrics
    ),
    deals AS (
      SELECT SUM(CASE WHEN is_won THEN 1 ELSE 0 END) * 1.0 / COUNT(*) AS win_rate
      FROM dundersign.opportunities
      WHERE is_closed AND {{ filter('lead_source', lead_source) }}
    )
    SELECT revenue, revenue_delta, active_users, users_delta, (SELECT win_rate FROM deals) AS win_rate
    FROM months WHERE month = (SELECT MAX(month) FROM months)
  documents: |
    SELECT month, 'Created' AS series, documents_created AS documents FROM dundersign_serving.monthly_metrics
    UNION ALL
    SELECT month, 'Completed', documents_completed FROM dundersign_serving.monthly_metrics
    ORDER BY 1, 2
  bookings: |
    SELECT lead_source, SUM(amount) AS bookings
    FROM dundersign.opportunities
    WHERE is_won AND {{ filter('lead_source', lead_source) }}
    GROUP BY 1 ORDER BY 2 DESC
  active_users: |
    SELECT month, active_users FROM dundersign_serving.monthly_metrics ORDER BY 1
  plans: |
    SELECT plan, COUNT(*) AS users FROM dundersign.users GROUP BY 1 ORDER BY 2 DESC
  monthly: |
    SELECT month, revenue, new_users, tickets_created, tickets_resolved
    FROM dundersign_serving.monthly_metrics ORDER BY 1

charts:
  k_revenue:
    label: Revenue
    query: kpis
    type: kpi
    value: revenue
    style:
      value:
        format: currency_whole
      support:
        format: delta
    support:
      value: revenue_delta
      label: vs prior month
  k_users:
    label: Active users
    query: kpis
    type: kpi
    value: active_users
    support:
      value: users_delta
      label: vs prior month
    style:
      support:
        format: delta
  k_win_rate:
    label: Win rate, all closed deals
    query: kpis
    type: kpi
    value: win_rate
    style:
      value:
        format: percent_whole
  documents_trend:
    title: Documents created vs. completed
    query: documents
    type: line
    x: month
    y: documents
    color: series
    height: 400
  bookings_by_source:
    title: Bookings by lead source
    query: bookings
    type: bar
    x: lead_source
    y: bookings
    sort:
      by: bookings
      order: desc
    height: 185
    style:
      orientation: horizontal
      axis_y:
        labels:
          format: currency_whole
  active_users_trend:
    title: Active users
    query: active_users
    type: line
    x: month
    y: active_users
    height: 185
  plan_mix:
    title: Users by plan
    query: plans
    type: donut
    theta: users
    color: plan
    total:
      label: Users
    height: 250
  monthly_table:
    title: Monthly detail
    query: monthly
    type: table
    style:
      columns:
        month:
          label: Month
        revenue:
          label: Revenue
          format: currency_whole
          align: right
        new_users:
          label: New users
          format: integer
          align: right
        tickets_created:
          label: Tickets opened
          format: integer
          align: right
        tickets_resolved:
          label: Tickets resolved
          format: integer
          align: right

rows:
  - cols:
      - width: "50%"
        text: |
          Support is the soft spot: tickets resolved trail tickets opened in every
          month, 245 opened against 86 resolved over the year. Bookings are spread
          evenly across sources, with Website, Referral, Download, and Paid Search
          within $220 of each other, so no single channel deserves the next dollar
          on its own.
      - width: "50%"
        cols: [k_revenue, k_users, k_win_rate]

  - cols:
      - width: "66%"
        rows: [documents_trend]
      - width: "34%"
        rows: [bookings_by_source, active_users_trend]

  - cols:
      - width: "66%"
        rows: [monthly_table]
      - width: "34%"
        rows: [plan_mix]
This repository is a read-only mirror of dbt Labs' private upstream. Issues are welcome; pull requests are not accepted. See CONTRIBUTING.md.
Getting started
Beta. dbt Charts is pre-1.0. Requires Python 3.11 to 3.13.
With an agent
Hand your coding agent one sentence. It runs the command in Are you an AI agent? and follows what it prints:
I want to make charts of this data with dbt Charts. Run `uv tool install dbt-charts`, then `dct skills intro`, and follow what it prints.
Manually
uv tool install dbt-charts   # or: pip install dbt-charts
dct --version
dct talks to your warehouse through dbt adapters and needs the adapter in its own
environment, so install the one you use as an extra:
uv tool install "dbt-charts[bigquery]"  # or: pip install "dbt-charts[bigquery]"
                                         # also: athena, clickhouse, databricks, fabric,
                                         # postgresql, redshift, snowflake, spark,
                                         # sqlserver, trino. DuckDB is built in.
Unreleased main ships as an unsupported dev build on every export:
uv tool install --prerelease=allow dbt-charts # or: pip install --pre dbt-chartsdct init # bootstrap a project (creates charts/guide.yml) dct validate charts/guide.yml # check board YAML for errors, no warehouse needed dct serve # live preview server
dct serve renders every board under charts/ and lets you move between them from the
breadcrumb:
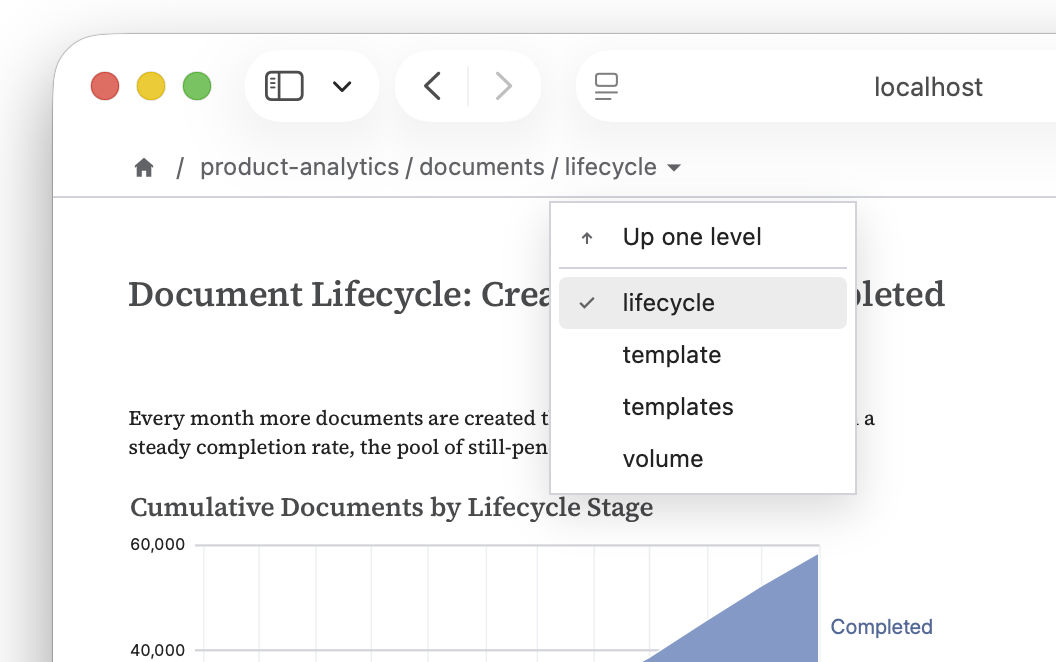
That is the short path. dct is a full CLI: it validates, renders to HTML, PDF, and
PNG, runs queries, searches boards, traces column impact, and carries the YAML reference
offline. The dct CLI section below lists the verbs.
Explore the dbtcharts.com platform for hosted boards and an enhanced collaboration experience.
dct CLI
While in beta, dbt Charts ships as a separate CLI, dct, short for data chart tool. It
mirrors dbt's shape: one verb per job.
dct validate [PATH]           # default: everything under charts/; --strict fails on warnings
dct serve [--port N] [--host H]
dct render BOARD... --format {html,pdf,png,svg,json}
dct query SOURCE 'SELECT …'   # run raw SQL, or a named board query
dct search <query>            # find boards by keyword
dct impact <column>           # which boards reference a column
dct docs [TOPIC]              # built-in YAML reference
dct examples [SLUG]           # bundled board specimens
Project verbs read DCT_PROJECT_DIR when --project-dir is not passed. The
CLI reference lists every
environment variable.
Agent skills and MCP
The dct CLI ships with all the skills and tools agents need to query datasets and
write, render, and serve dashboards. It is the recommended tool for agents to work with,
but also ships with a local MCP server for surfaces like VS Code where one is required.
dct skills           # list the bundled skills; `dct skills intro` is the entry point
dct init skills      # install them into the project for file-based agent discovery
uv tool install "dbt-charts[mcp]"   # or: pip install "dbt-charts[mcp]"
dct init mcp      # wire the MCP server into Cursor, VS Code, Claude Desktop, Codex, and others
VS Code extension
dbt Charts for VS Code
adds syntax highlighting for the YAML, the SQL inside it, and Jinja; schema-backed
autocomplete and hover docs; diagnostics as you type; and a live preview beside the editor
that re-renders on save and honors the board's filters. The preview shells out to dct render, so install the CLI first. Details in
the docs.
dbt Charts is also available on Open VSX for VS Code-compatible editors (e.g. Cursor, Windsurf)
Examples
One variable, one query, one chart, and the whole board fits on a screen. It runs against the Playground's demo data, and the link under it opens the exact YAML there, live and editable:
source: db

variables:
  status:
    column: dundersign.documents.status

queries:
  documents: |
    SELECT DATE_TRUNC('month', created_at) AS month,
           SUM(COUNT(*)) OVER (ORDER BY month) AS documents
    FROM dundersign.documents
    WHERE {{ filter('status', status) }}
    GROUP BY 1

charts:
  growth:
    title: Documents created, all time
    type: area
    query: documents
    x: month
    y: documents

rows:
  - growth
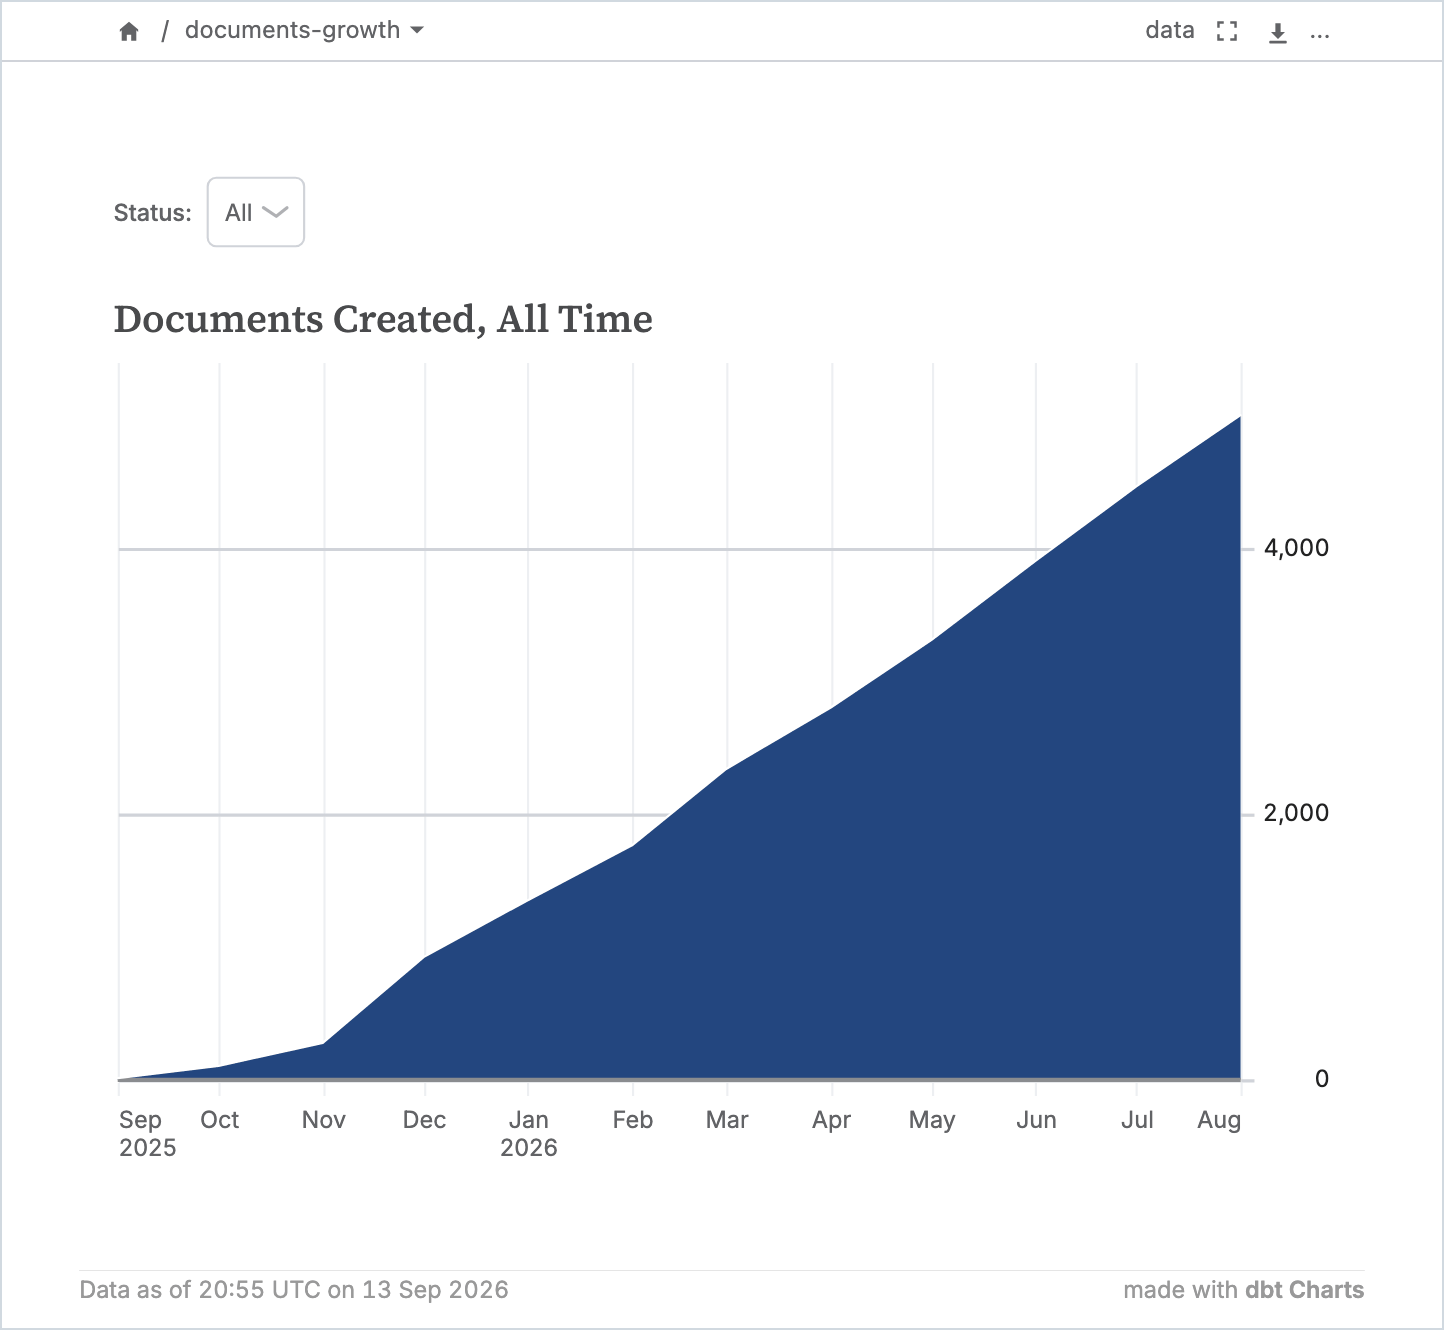
Open this board in the Playground
More complete boards, all on the same demo data:
- Examples in the docs: a KPI board, an interactive board, nested layouts, and a drill-down, each paste-ready for the Playground.
- The Playground's own gallery, under Examples at play.dbtcharts.com: chart families, composed shapes, layered charts, cards, tables, variables, and full boards.
dct exampleslists the specimens bundled with the package, each with inline data so it renders anywhere.dct skills intropoints a coding agent at them.
Using with dbt
A dbt project isn't required. charts/ can stand alone and query your warehouse
directly. Keeping it inside a dbt project, next to models/, adds the following:
your_dbt_project/
  .git/
  dbt_project.yml
  dbt_charts.yml
  models/
  charts/
    revenue.yml
- Boards query models with
ref(), so a column rename and the boards that read it ship on one branch, in one pull request, through one CI run. - Your dbt profile is the connection. No second set of credentials.
dct impact <column>answers "which boards break if I change this" before you change it.dbt parsein CI validates everyref()andsource()a board uses.
What this version supports
Local sources: CSV, Parquet, JSON, DuckDB.
Warehouses: Athena, BigQuery, ClickHouse, Databricks, PostgreSQL, Redshift, Snowflake, Spark, Trino. Each is installed as an extra: Trino connects through its own Python client, the rest through dbt adapters.
Output formats: dct serve for a live board with working filters. dct render to
HTML, PDF, PNG, SVG, JSON, and even
terminal.
Core chart types (16): bar, histogram, line, area, scatter, heatmap, pie, donut, KPI, table, point map, bubble map, choropleth map, geoshape, callout, spark bar. See chart types.
Semantic chart types (13): composed from the core types with a few style keys: lollipop, bullet, slope, bump, dot plot, stacked bars, normalized bars, streamgraph, funnel, target and reference lines, moving averages, ranges, small multiples. Open composed shapes, layered charts, and series and small multiples in the Playground.
Themes (5 built in): selected with one theme: key.
clarity (the default),
paper,
vivid,
neon, and
stark. A custom theme is a YAML file
that extends one of them; see themes.
Validation and CI
Errors and warnings carry a code, a file and line, a suggested fix, and a pointer into
dct docs. Agents cannot see rendered output, so each message is written to be acted on
from the text alone.
dct validate checks structure without a warehouse:
$ dct validate charts/signups.yml
ERR-VALIDATION-FIELD  Field 'charts.signups': Unknown chart type 'lien'. Did you
mean 'line'? Supported chart types: bar, histogram, line, area, scatter,
heatmap, pie, donut, kpi, table, point_map, bubble_map, map, geoshape, callout,
spark_bar.
At: charts/signups.yml:9
Docs: dct docs board
dct render runs the queries and checks the result:
$ dct render charts/signups.yml
⚠ 1 warning:
WARN-Y-ENCODING-MOSTLY-NULL  signups: Chart 'signups': y field 'user_count' is
100% NULL across 12 rows.
Fix: Check for a broken join or a nullable source column. A COALESCE or WHERE
clause may be needed to filter the empty rows.
Field: user_count
At: charts/signups.yml:13
Docs: dct docs charts
dct init ci writes a GitHub Actions workflow that runs dct validate on every pull
request that touches your boards, with no warehouse credentials. --strict fails on warnings. A dbt parse step
also checks ref() and source() calls against your models.
Migrations
The YAML syntax will change before 1.0. Boards written against an older syntax still
parse: the engine recognizes the older shape and migrates it in memory. dct migrate
rewrites the files themselves to the latest released syntax; see
dct migrate.
How it works
board YAML → compile (validate, resolve theme + layout)
           → execute (SQL against your warehouse via dbt adapters)
           → render  (Vega-Lite specs → live HTML, static HTML, PDF, PNG, SVG)
Built on Pydantic (schema validation), Jinja2 (templating, as in dbt), Vega-Lite via
vl-convert (charting), and FastAPI (the preview server).
Documentation
Contributing
Development happens in a private upstream repository and is mirrored here read-only. Pull requests opened against this repository are closed unmerged; bug reports and feature requests are welcome via GitHub Issues. See CONTRIBUTING.md and SECURITY.md.